scRNAseq spatial inference
Introduction
In order to understand the regulation of morphogenesis, it is paramount to understand both the dynamics of gene expression at the single-cell level, as well as, interactions between the transcriptomic state of neighboring cells. With the advent of single-cell sequencing technology, it has now become possible to directly measure the transcriptome of cellular aggregates at cellular resolution, however, parameterizing such data by space remains challenging. Specifically, in the process of isolating individual cells for downstream sequencing, embryonic cells must be dissociated and suspended in liquid. This prevents straightforward application of scRNAseq technology to the problems of Developmental Biology.
The straightforward resolution to this conundrum is to leverage pre-existing databases of known in-situ markers. Such curated datasets should provide the spatial expression profiles for a small subset of genes that could be matched against scRNAseq counts measured from the same organism at the same stage of development. Once such a subset of genes are "matched" between the in-situ and scRNAseq data, the spatial pattern for each gene for the remainder of the transcriptome would come for "free." The collection of estimated gene expression patterns would function as a high-resolution atlas over physical space of the embryo's shape; a potentially important resource for researchers.
Additionally, such an inference would provide us with an estimate of the position on the embryo each cell was sampled from. Assuming one has the ability to detect the intrinsic manifold of gene expression, as detailed elsewhere, such positional labels would provide an interesting overlay to attempt to learn the genotype to space map encoded by the genome. Below we provide an (incomplete) overview of past attempts at this problem, as well as detail our attempt to infer the position of scRNAseq cells.
Overview of current methods
FILL ME OUT There are published techniques that attempt to solve this problem, however our attempts to utilize them were unsuccessful.
Our approach
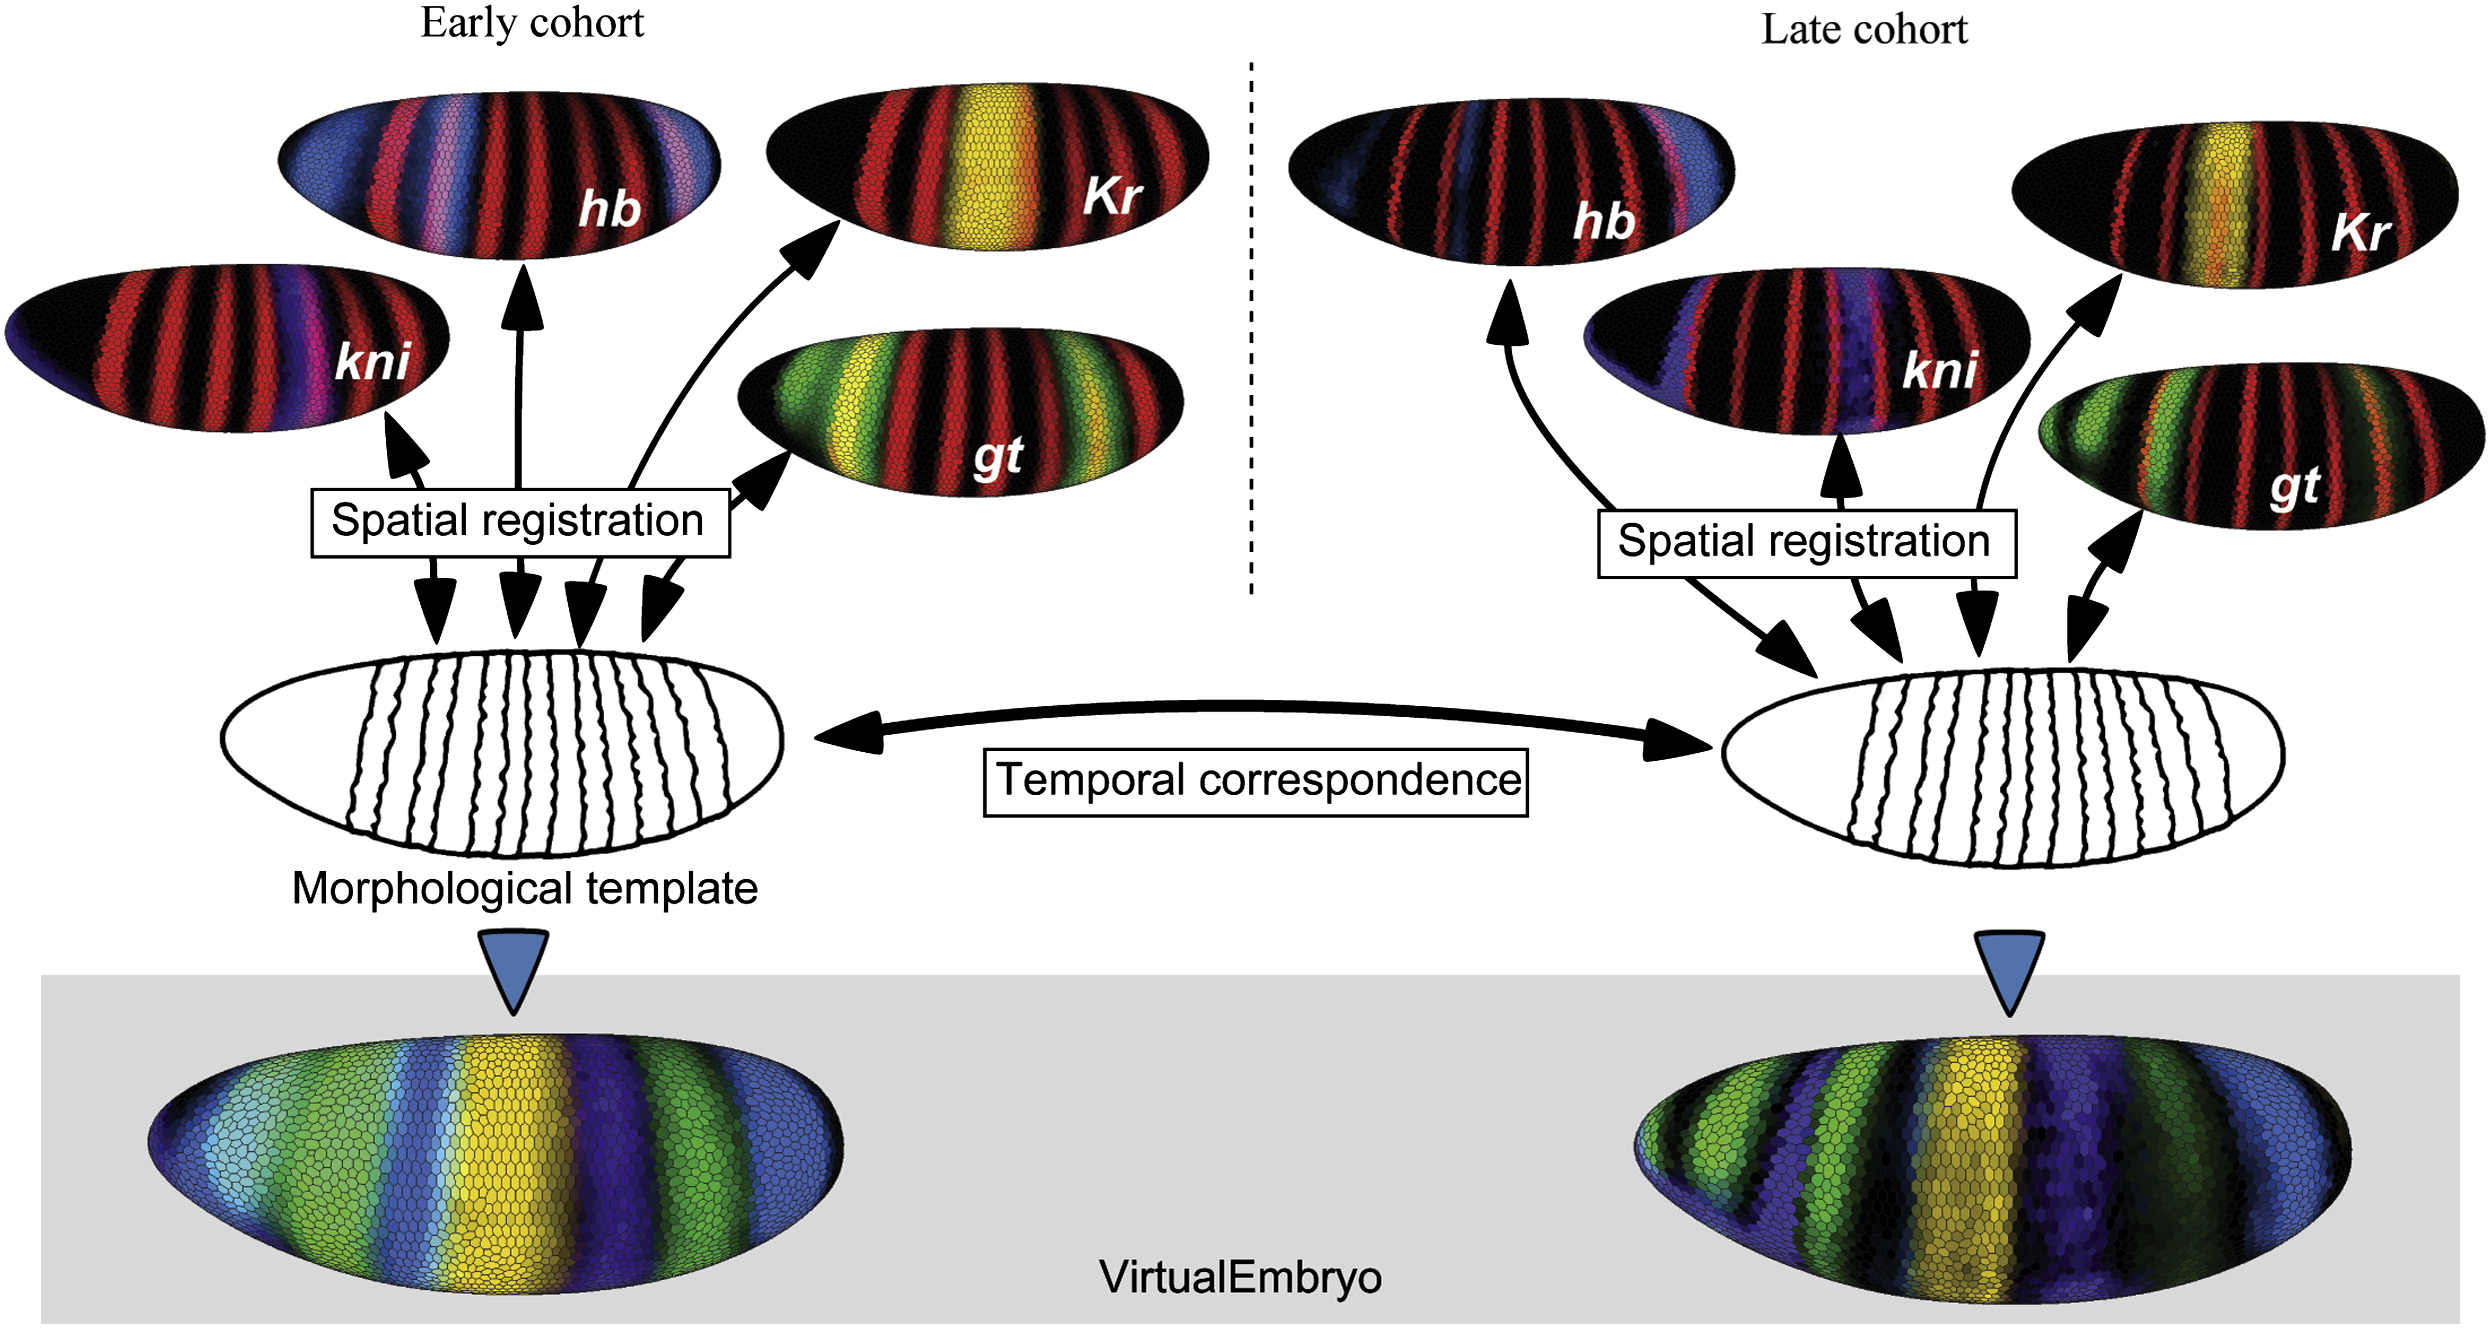
While the below discussion is general, all results shown within the context of Drosophila melongaster and thus will be utilizing the Berkeley Drosophila Transcriptional Network Project database [1]. Specifically, the BDTNP collaboration produced a "virtual embryo" pointcloud discretizing the spatial expression pattern of $84$ genes. The virtual embryo was constructed by aligning florescent pointcloud data obtained by FISH of similarly staged embryos.
Objective function
Let $\alpha$ and $a$ denote indices over scRNAseq cells and embryonic spatial positions respectively. Our goal is to solve for the sampling probability distribution $\rho_{a\alpha}$, i.e. the probability that cell $\alpha$ was sampled from position $a$. We pose this problem using the tools of Statistical Physics and thus formulate the solution as the extrema of the following free energy
\[ \tag{1} F(\rho_{a\alpha}) \equiv \displaystyle\sum\limits_{\alpha,a} \epsilon\left(\vec{g}_\alpha,\vec{G}_a\right)\rho_{a\alpha} + T\rho_{a\alpha}\log\left(\rho_{a\alpha}\right)\]
where $\vec{g}_\alpha$ and $\vec{G}_a$ denote the transcriptomic state of cell $\alpha$ and position $a$ respectively. We note that, as formulated, this problem is equivalent to regularized optimal transport[2]. $\epsilon$ denotes the energy required to map cell $\alpha$ onto position $a$. For now, we leave the functional form generic but denote that it explicitly depends upon the gene expression value of both the sequenced cell $\alpha$ and the in-situ position $a$. Additionally, $T$ is a parameter analogous to a thermodynamic "temperature"; it controls the precision that we demand of the inferred position for each sequenced cell. As $T \rightarrow 0$, each cell is constrained to injectively map onto a spatial position; the problem reduces to the assignment problem[3]. Conversely, as $T \rightarrow \infty$, the entropic term dominates; the solution converges onto the uniform distribution.
However, if extremized as written, Eq. (1) would not result in a well-formed probability distribution. Specifically, we must additionally constrain the row and column sum of $\rho_{a\alpha}$ to have correctly interpretable marginals. As such, in order for $\rho_{a\alpha}$ to be interpreted as the probability that cell $\alpha$ was sampled from position $a$, $\forall \alpha \ \sum_a \rho_{a\alpha} = 1$ must hold. Additionally, we assume there were no biases in cellular isolation during the sequencing procedure. Thus each position is assumed to be sampled uniformally, and thus impose uniform spatial coverage $\forall a \ \sum_\alpha \rho_{a\alpha} = \frac{N_c}{N_x}$. $N_x$ and $N_c$ denote the number of in-situ positions and sequenced cells respectively. Taken together, our full free energy is of the form
\[ \tilde{F}(\rho_{a\alpha})\!\equiv\!\displaystyle\sum\limits_{\alpha,a} \epsilon\left(\vec{g}_\alpha,\vec{G}_a\right)\rho_{a\alpha} + T\rho_{a\alpha}\log\left(\rho_{a\alpha}\right) + \displaystyle\sum_a\Lambda_a\left[\frac{N_c}{N_x}\!-\!\sum_\alpha \rho_{a\alpha} \right] + \displaystyle\sum_\alpha \lambda_\alpha\left[1\!-\!\sum_a\rho_{a\alpha} \right]\]
The solution is found to be
\[ \tag{2} \rho_{a\alpha}^* = e^{\Lambda_a} e^{-T^{-1}\left(\epsilon\left(\vec{g}_\alpha,\vec{G}_a\right)-1\right)} e^{\lambda_\alpha}\]
where $\Lambda_a$ and $\lambda_\alpha$ are determined by utilizing the Sinkhorn-Knopp algorithm in conjunction with the marginal constraints prescribed above. Eq. (2) provides a fast, scalable algorithm to estimate the sampling posterior given any cost function $\epsilon(\vec{g}_a,\vec{G}_\alpha)$. All that remains is to formulate an explicit model.
Microscopic model
As seen by Eq. (2), the cost function can be viewed as the energy of a Boltzmann distribution: $E\left(\vec{g}_\alpha, \vec{G}_a\right) \equiv \left(\vec{g}_\alpha, \vec{G}_a\right)$ Hence, an obvious interpretation of $E(\vec{g}_\alpha, \vec{G}_a)$ is as the negative log-likelihood that $\vec{g}_\alpha$ and $\vec{G}_a$ were sampled from the sample entity. Our first simplifying assumption is that genes within the database are statistically independent of each other and thus the log likelihood is additive
\[ \tag{3} E(\vec{g}_\alpha, \vec{G}_a) = \frac{1}{N_g}\displaystyle\sum\limits_{i=1}^{N_g} \varepsilon\left(g_{\alpha i}, G_{ai}\right)\]
where $i$ indexes genes and $\varepsilon$ denotes the single-body energetics. Thus the problem has been reduced to parameterizing the log-likelihood that $g_{\alpha i}$ and $G_{ai}$ were sampled from the same underlying cell. However, the complication is that our scRNAseq data and the in-situ expression database are not directly relatable. Both datasets are in manifestly different unit systems, the scRNAseq data are expressed in UMI counts while the underlying database is ultimately florescent intensity collated from a myriad of FISH experiments.
We postulate that the "true" transformation that maps scRNAseq counts $g_{\alpha i}$ to florescent intensity $G_{ai}$ should minimize distortions between both observed distortions under the action of said map. This ultimately suggests we identify the putative transformation via minimizing the Wasserstein metric via optimal transport [4]. It has been shown [5] that strictly convex cost functions $\varepsilon$ between $1$D distributions admit a unique optimal transport solution. Specifically, if we denote the cumulative density of $g_{\alpha i}$ and $G_{ai}$ by $\phi_{i}$ and $\Phi_{i}$ respectively, the minimizing transformation is given by $\Phi_{i}^{-1} \circ \phi_{i}$. We assume a Gaussian sampling probability with mean given by the BDTNP database such that our one-body energy takes the form
\[ \tag{4} \varepsilon\left(g_{\alpha i}, G_{ai}\right) \equiv \left(\Phi^{-1}_i\left(\phi_i\left(g_{\alpha i}\right)\right) - G_{ai}\right)^2\]
Importantly, we have enforced that each gene has unit variance within its sampling distribution. Non-unit uniform variance would simply rescale our temperature parameter and thus can be ignored. Conversely, heterogeneous variances would effectively act as a additive weighting prefactor in the summation of Eq. (3). We do not consider this case here but note that it is an interesting avenue for future improvement.
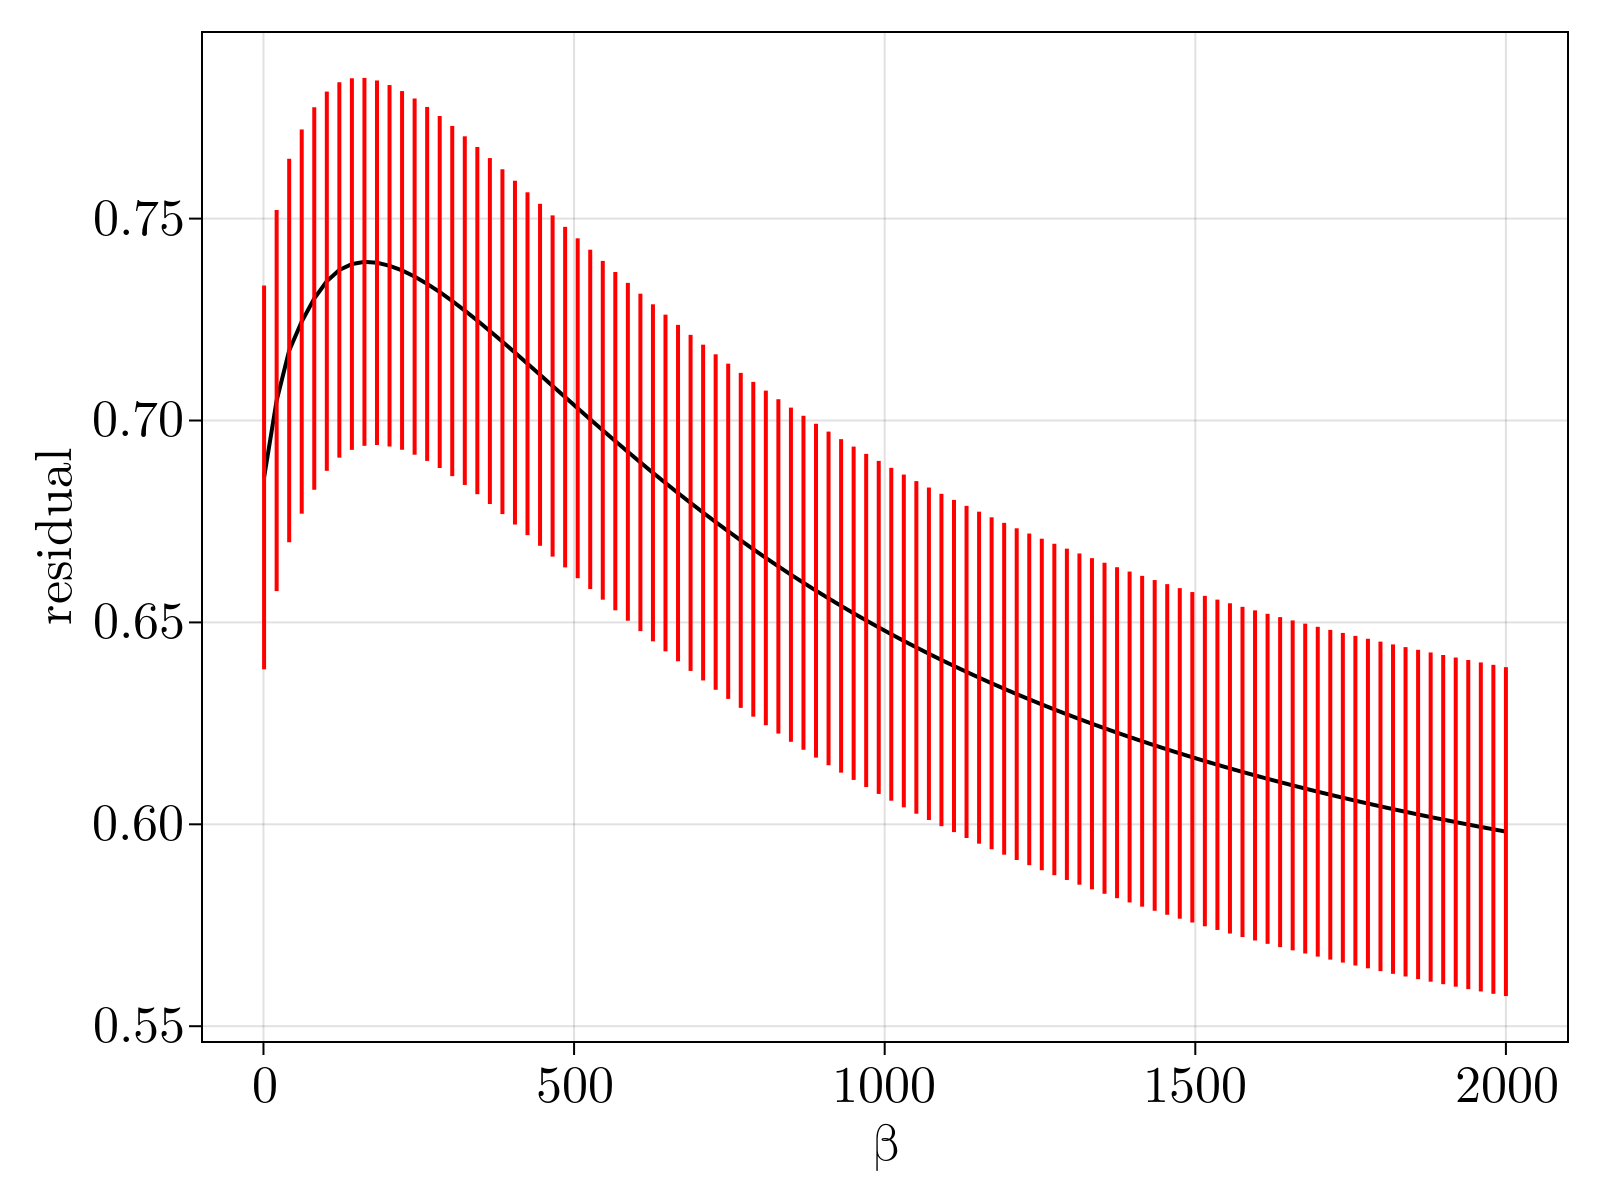
Eqns. (2-4) uniquely determine the sampling probability $\rho_{a\alpha}$ modulo one free parameter, temperature $T$. A priori we expect the fit of gene expression to the database to be non-monotonic with respect to temperature. Minimizing of Eqn. (1) is singular as $T \to 0$ and reduces to the assignment problem and thus is expected to be highly susceptible to noise. Conversely, as $T \to \infty$ the entropic contribution to Eqn. (1) dominates and thus admits a uniform sampling distribution with no patterning. As such, we fix the temperature by hyperparameter optimization, i.e. to be the value that maximally correlates to the original BDTNP database.
Results
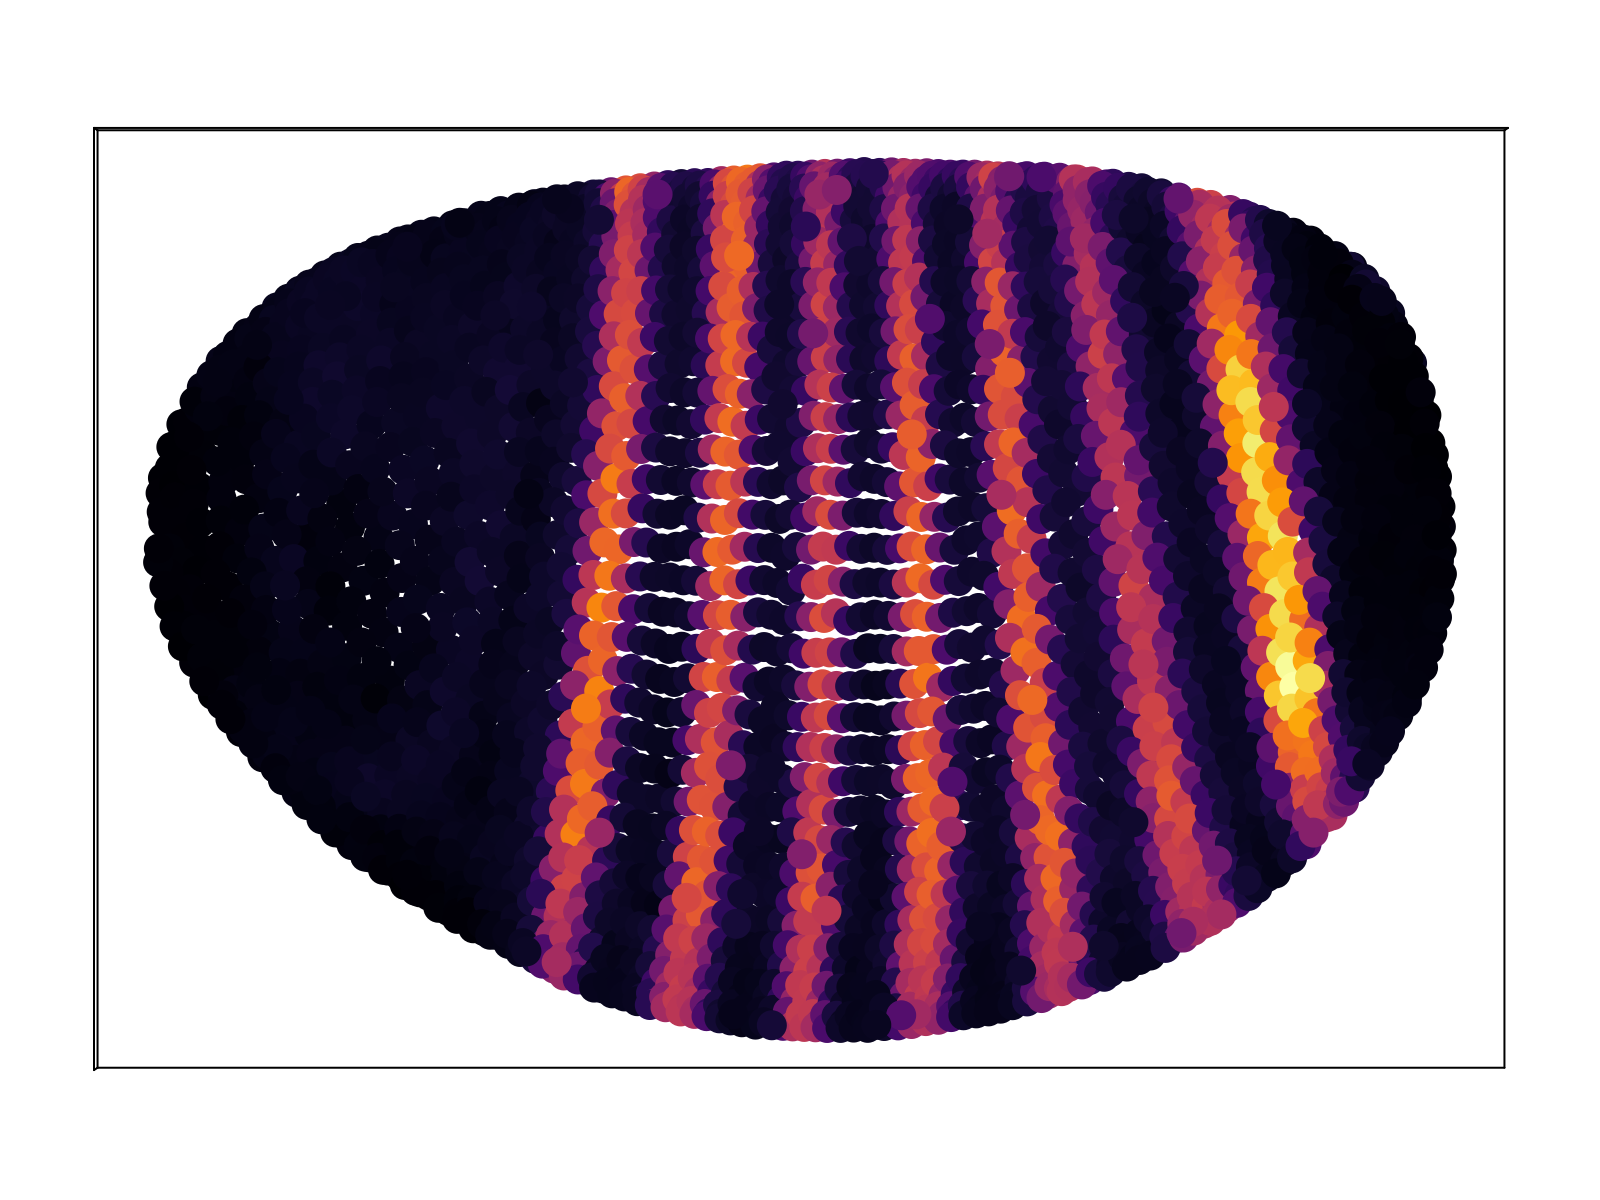
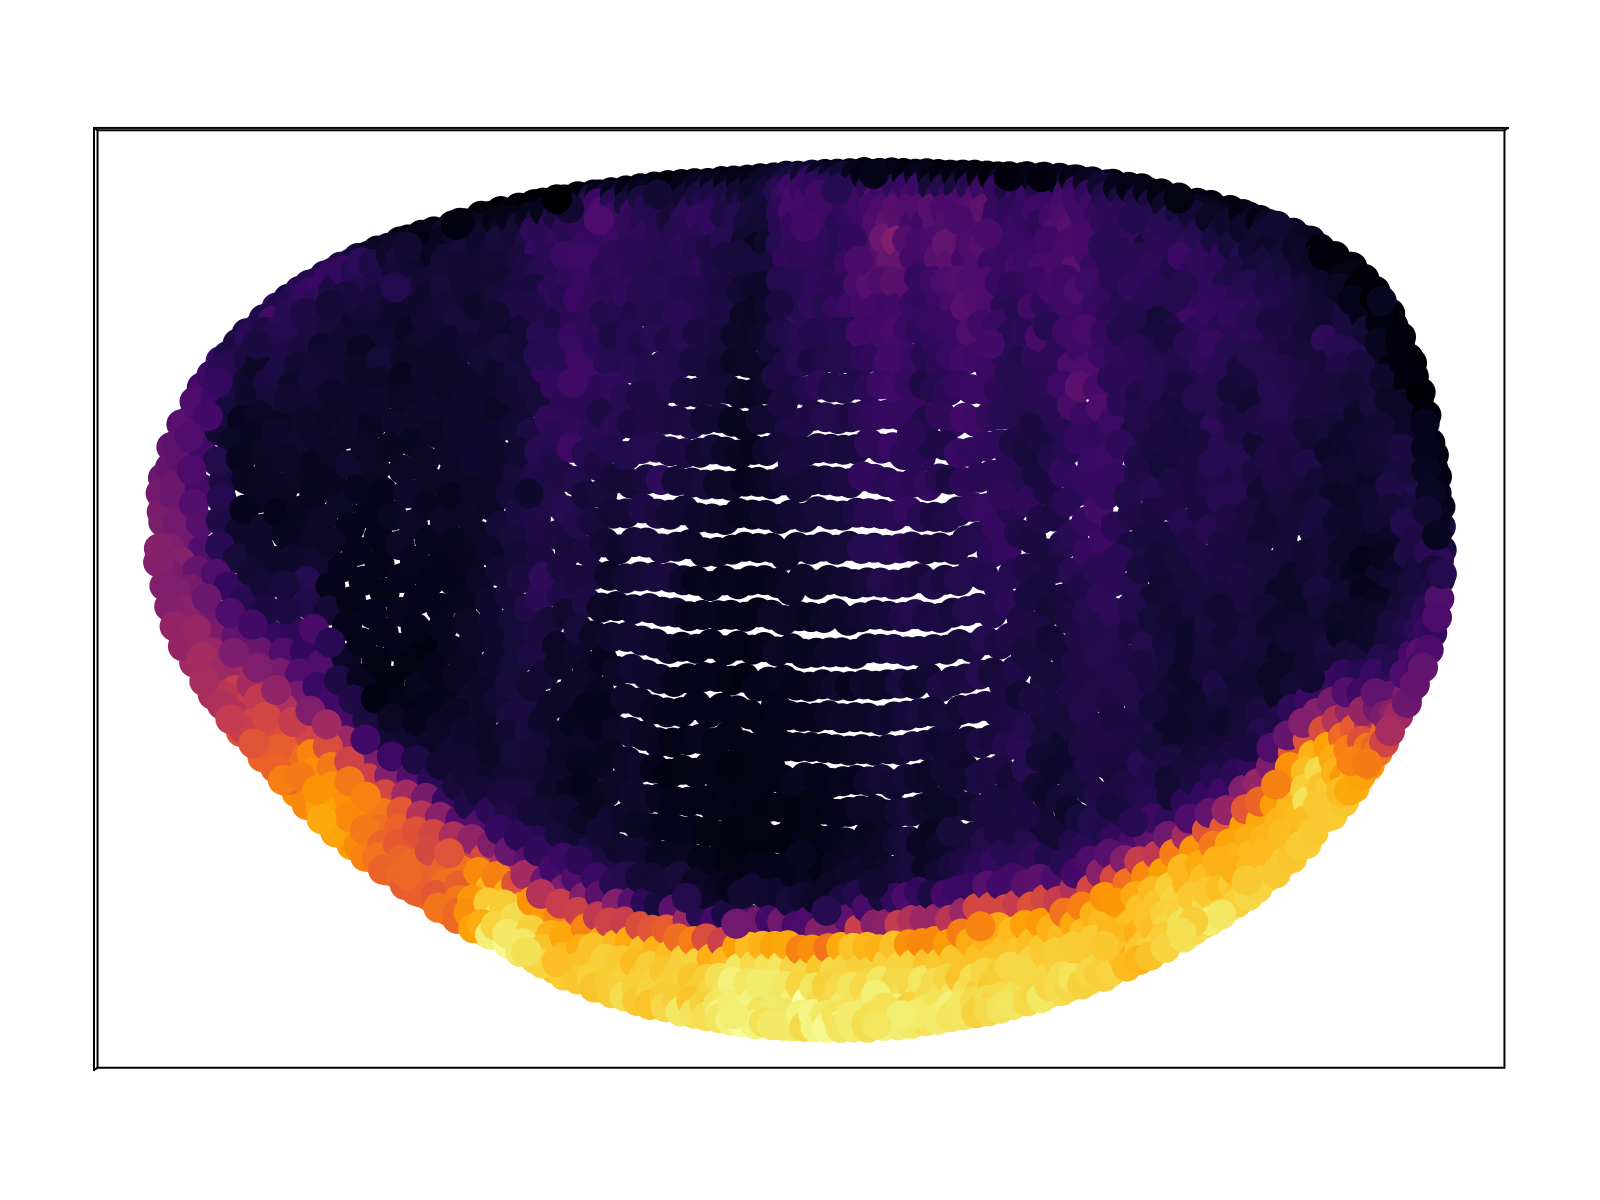
Once the sampling probability $\rho_{a\alpha}$ is known, we can immediately compute the mean expression profile for each gene
\[ \bar{g}_{ia} \equiv \displaystyle\sum\limits_{\alpha} \rho_{a\alpha} g_{i\alpha}\]
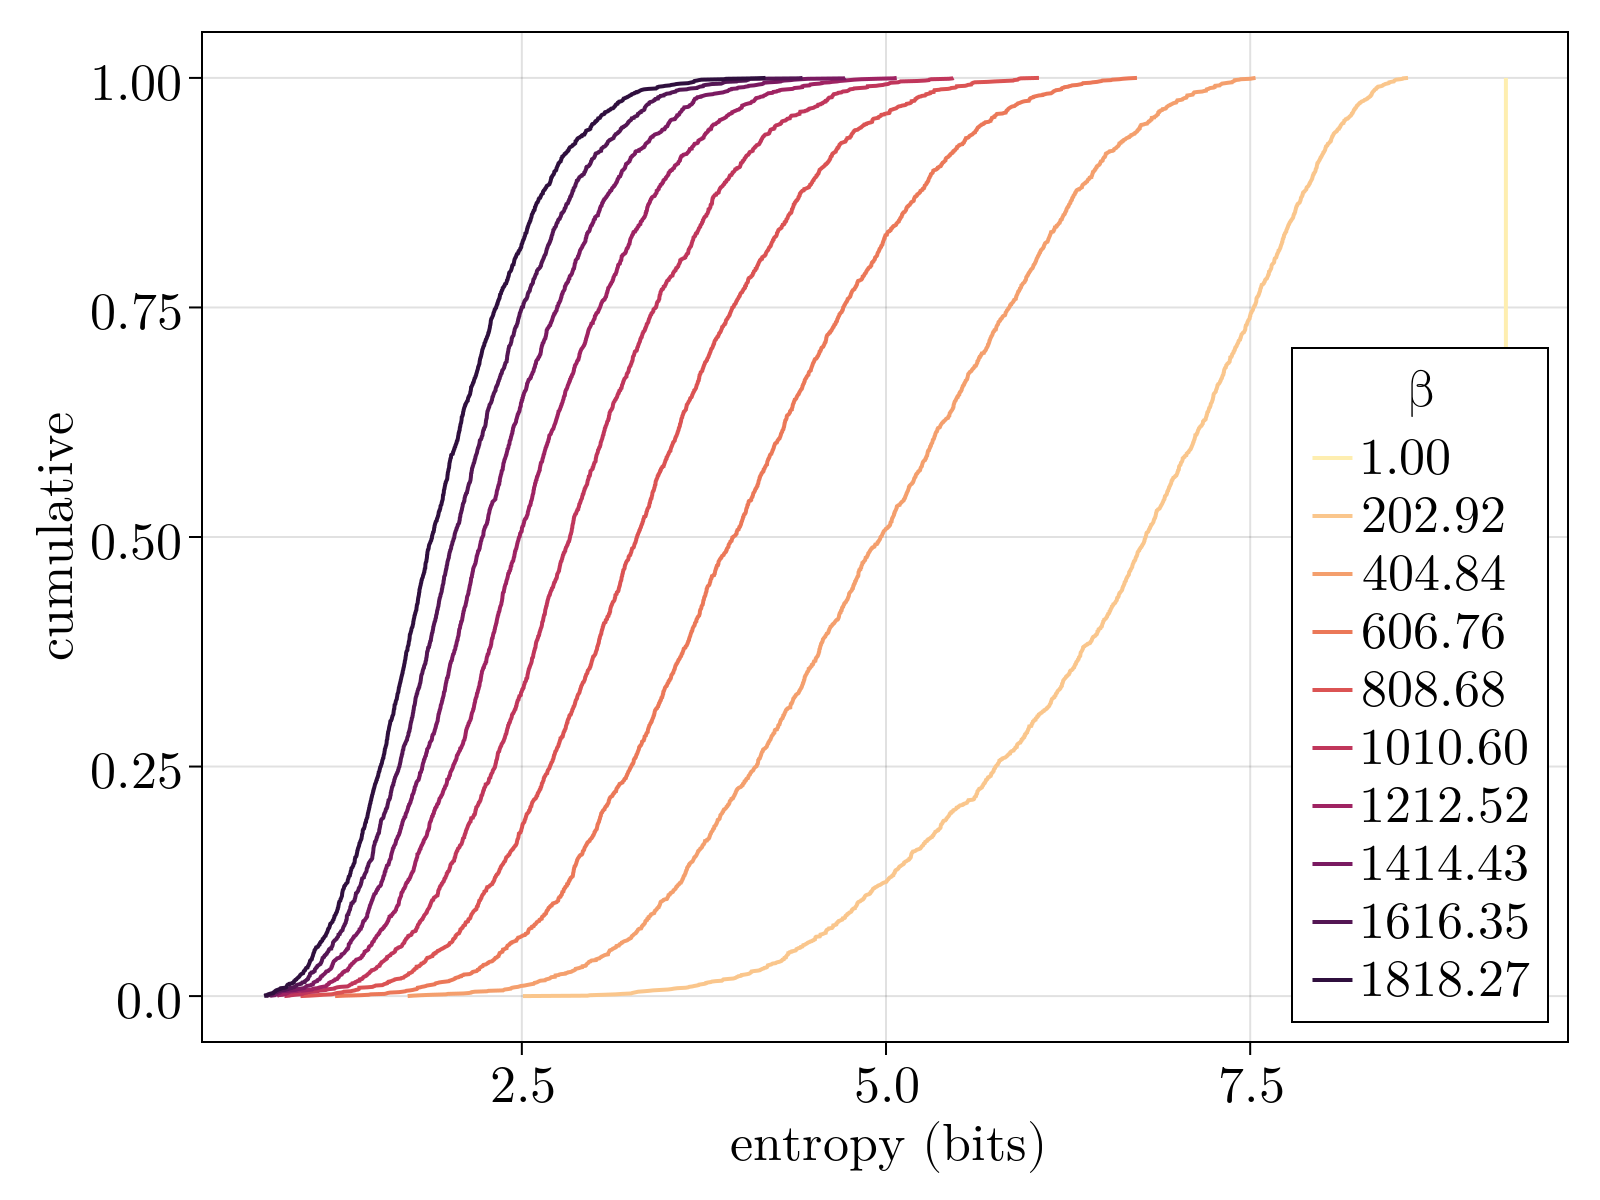
We compare the computed mean expression profile to the "known" pattern as given by the BDTNP database. As shown in the figure below, we capture $\sim 70\%$ of the variance of the database, on average across all $84$ genes, at the optimal temperature. The red vertical bars display the standard deviation across all genes. The mapping at the optimal temperature corresponds to a sampling entropy $\rho_{i\alpha}$ of $\sim 6$ bits, corresponding to each scRNAseq cell mapping to $\sim 60$ positions of the embryo.
We note that our positional precision is significantly less than what has been found in previous studies utilizing florescence data [6] that concluded gene expression could identify position with subcellular accuracy. The origin of the discovered "imprecision" is likely multifaceted owing, in part, to technical noise inherent to scRNAseq technology, systematic errors due to mistiming of the embryo stage between the database and scRNAseq data, as well as true biological variation associated to the full 2D positional information. Deconvolving the contributions of each stochastic process to our measurement error is an interesting future direction for research.
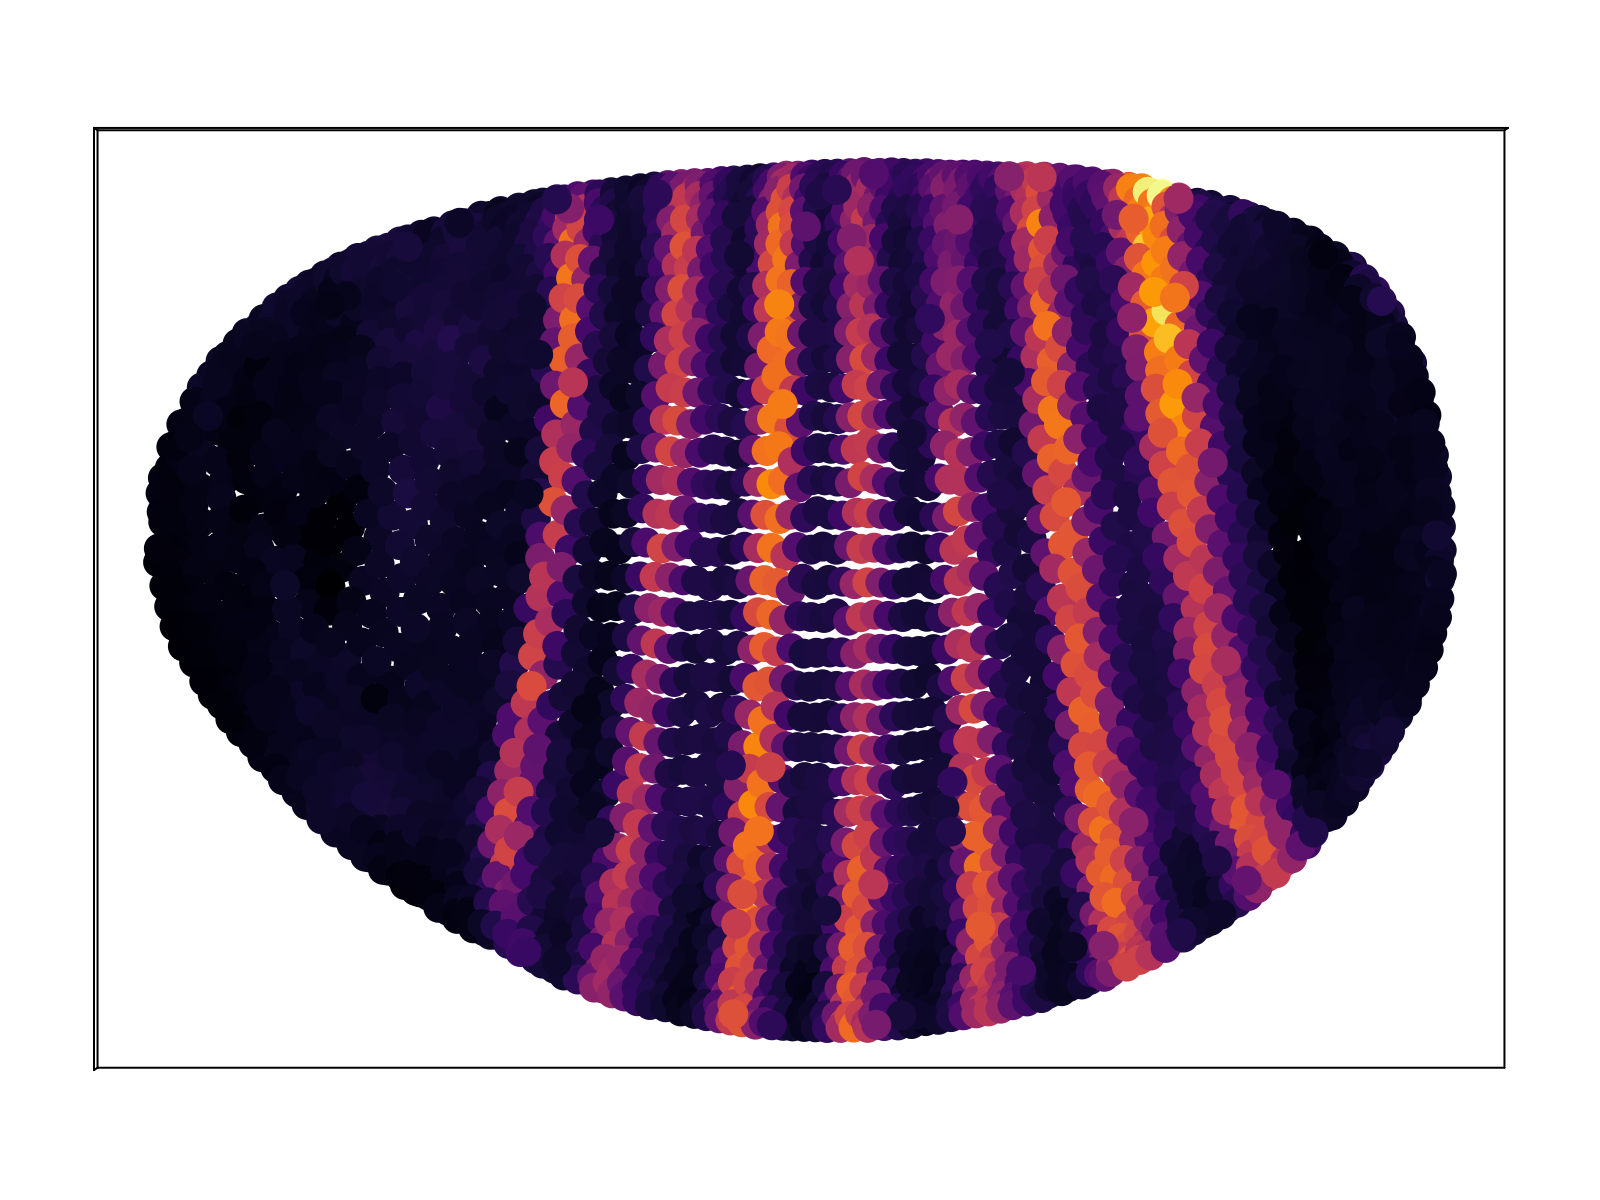
In addition to matching the small subset of genes contained within the BDTNP database, we also produce predictions for gene expression for the remaining $\sim 10^4$ genes. The full database of predictions is available upon request; an exploratory web front-end is currently underway. Below we display a representative sample.
Discussion
Unfortunately, such databases only exist for a select few model organisms and thus limit the applicability of this approach. Our hope is to leverage phenomenology gleaned from the correlations between expression and space for organisms with such a database that
- 1Registering Drosophila Embryos at Cellular Resolution to Build a Quantitative 3D Atlas of Gene Expression Patterns and Morphology
- 2Sinkhorn Distances: Lightspeed Computation of Optimal Transportation Distances
- 3Computational optimal transport: With applications to data science
- 4Optimal transport: old and new
- 5Mass Transportation Problems: Volume I: Theory
- 6Positional information, in bits